Femap provides powerful visualization and data editing tools to make sense of results from your solver. The postprocessing toolbox, beam visualization, the data table, and freebody diagrams are just a few of the tools that will help you find and analyze the data you are interested in.
Keep reading to learn more about all the postprocessing tools that Femap has to offer.
Viewing Your Results
Femap Can Display Data in Many Forms
Typically a lot of results data can be generated by the analysis, and the ability to investigate all of this data efficiently and present it concisely is one of Femap’s strengths.
Postprocessing tools include the ability to animate displacement plots, and view results inside a solid model with the Dynamic Cutting Plane and the Dynamic Isosurface.
Full control of results selection before analysis
Full control of results viewing post analysis
Contour results can be plotted on shell elements as if they were 3D elements – showing plate thicknesses with a linear stress interpolation through the thickness.
XY plots are available with the powerful charting capability. View the demonstration of Femap’s charting capabilities:
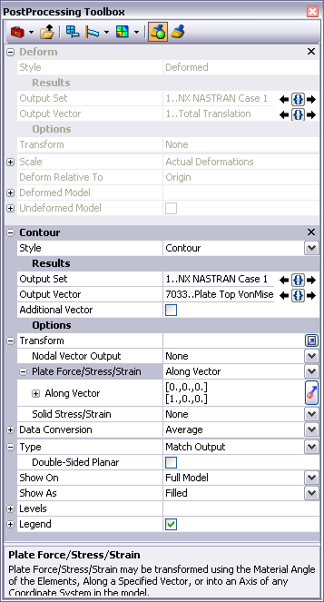
Post-Processing Toolbox
Access Post-Processing Options
The Postprocessing Toolbox consolidates access to the most used or popular viewing options, in Femap, into a single pane.
The Postprocessing Toolbox allows you to quickly and interactively setup and change post-processing options.
FEMAP can show detailed beam cross section contour plots of stress distributions and shear flows to reveal the full beam behavior in an analysis. Full control of the forces used to calculate the stress distribution is available, and other stress types, such as von Mises, can be calculated.
Other forms of beam results viewing that are supported include visualization of beam diagrams (bending moment and shear force) for beam type structures.
Beam Postprocessing Demonstration
Manipulating Your Results Data
Sorting Data
Further calculation or extrapolation of the solver data is sometimes necessary to obtain the desired information.
Organization and sorting of data into particular studies can facilitate comprehension of results, in particular locating and comparing maxima and minima across multiple load cases. Interaction with third party programs and tools (such as Microsoft Excel) can also help efficient understanding of model behavior.
Femap has powerful data manipulation tools that can help with results studies organization.
Free Body Tools
Show Loads
Grid point force data recovery, that is calculated by the solver, provides some very useful output that helps to determine load paths through the structure.
Femap provides some capabilities that work with this data to provide free body diagrams for parts and components, balancing loads at section cuts in the model, and showing interface loads between components.
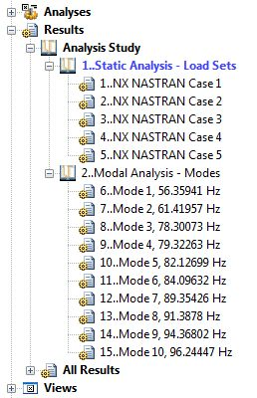
Output sets can be organized into Analysis Studies to help order the output data into more understandable groups. The studies can be created automatically when importing or attaching results data, or manually from existing data.
Organizing the output data in this way makes to easier to find, delete or operate on a collection of output sets from analysis runs.
For example, you can group output sets from statics, modes and time steps from a transient analysis into separate analysis studies and operate on them individually.
Results Enveloping
Femap Tools for Data Manipulation
To quickly gain an understanding of the worst cases in a set of load cases, Femap provides a Results Enveloping capability.
You can create a single stress contour which shows element by element the worst stress state in a given set of load cases. You can also generate a criteria plot showing the load set number of the worst stress for each element.
Tools like these that can manipulate output data and present the critical information help to speed up simulation postprocessing.
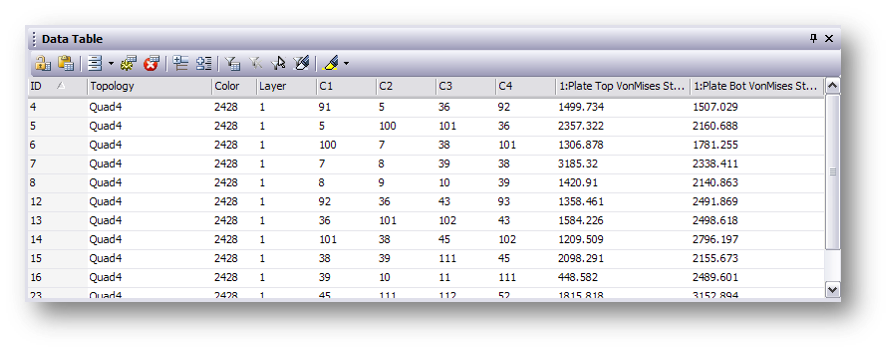
Data Table
Femap Data Organization
Another method of manipulating output data in Femap is the Data Table. You can unlock the Data Table and send either modeling or results data to it. The Data Table allows you to sort, filter and evaluate data that it contains.
You can use it to rank results or compare data from different output sets or models. You can also copy the data to the clipboard and transfer it to third party programs like Microsoft Word and Excel.